Dashboard
Data trends
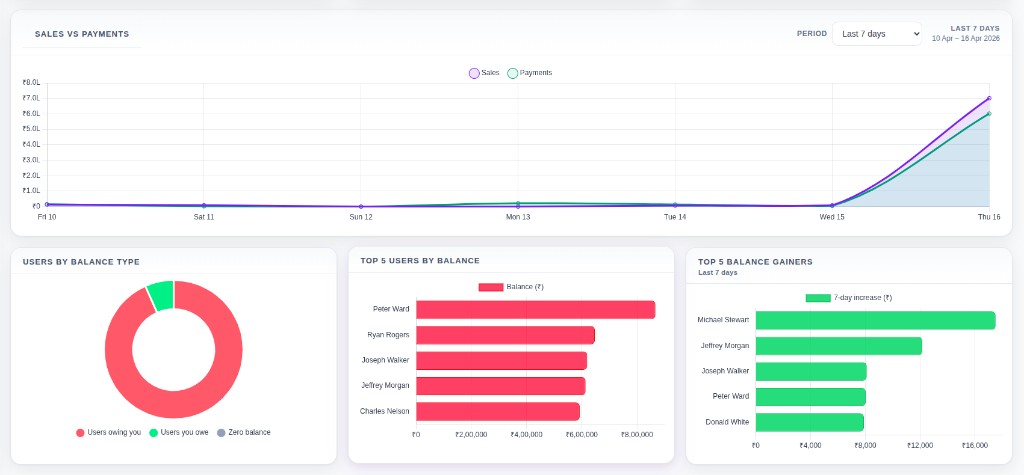
Track business trends over time with visual insights for sales, collections, expenses, and overall performance.
Overview
The data trends page helps chicken dealers understand how the business is performing over time instead of looking at only one day's numbers. It gives a clearer visual view of sales, collections, expenses, and overall movement so trends can be compared across different dates or periods. This helps dealers make better decisions, spot changes early, and understand business growth more clearly on chickenpro.in and app.chickenpro.in.
- Real-time data
- Mobile friendly
- Easy navigation
- Quick actions
Trend overview
3 items
- Shows how business numbers move over time instead of only one day at a time.
- Helps the dealer understand whether the business is improving or slowing down.
- Gives a clearer trend overview for planning and review.
Sales, collections, and expenses
3 items
- Tracks sales trends across selected dates or periods.
- Shows collection movement and expense changes visually.
- Makes it easier to understand where money is coming in and going out.
Performance comparison
3 items
- Helps compare business performance across different dates or time ranges.
- Useful for checking growth, decline, or unusual changes.
- Supports better decision-making with visual comparisons.
Better business decisions
3 items
- Turns raw business data into easier-to-understand trends.
- Helps spot important patterns early.
- Useful for chicken dealer management and poultry business analysis.
Use Cases
Sales trend analysis
Scenario: View weekly and monthly sales trends to identify peak periods and seasonal patterns.
Benefit: Plan inventory and staffing based on historical sales patterns.
Customer performance
Scenario: Analyze which customers contribute most to revenue and identify high-value accounts.
Benefit: Focus relationship-building efforts on most profitable customers.
Business forecasting
Scenario: Use trend data to forecast future sales and plan business growth strategies.
Benefit: Make proactive business decisions based on data-driven insights.
Benefits vs Features
Visual trend charts
Understand business patterns without complex data analysis
Customer performance ranking
Identify your most valuable customers instantly
Comparative analysis
Compare different time periods to measure growth
Business forecasting tools
Plan for the future based on historical data
Related dashboards
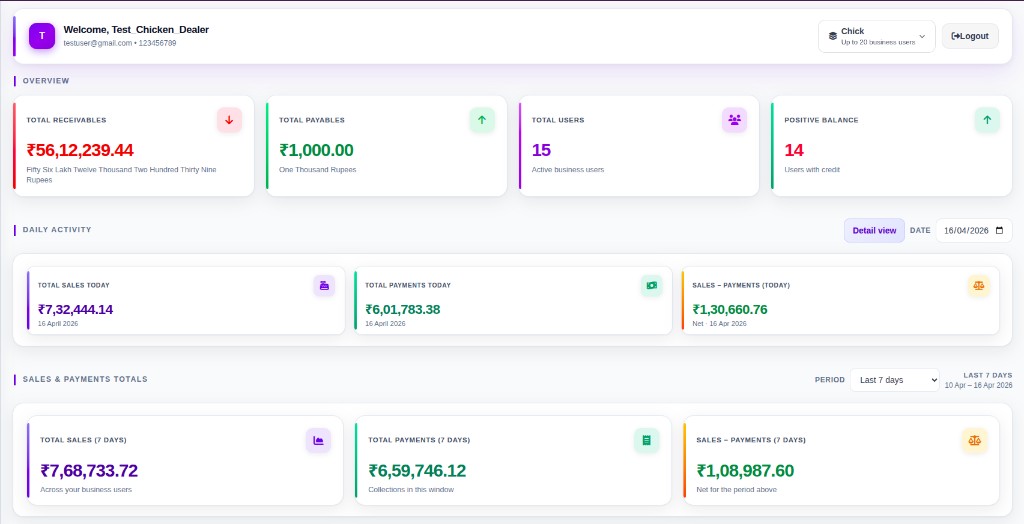
Dashboard overview
A single view of the numbers that matter most so you can check business performance in seconds.
View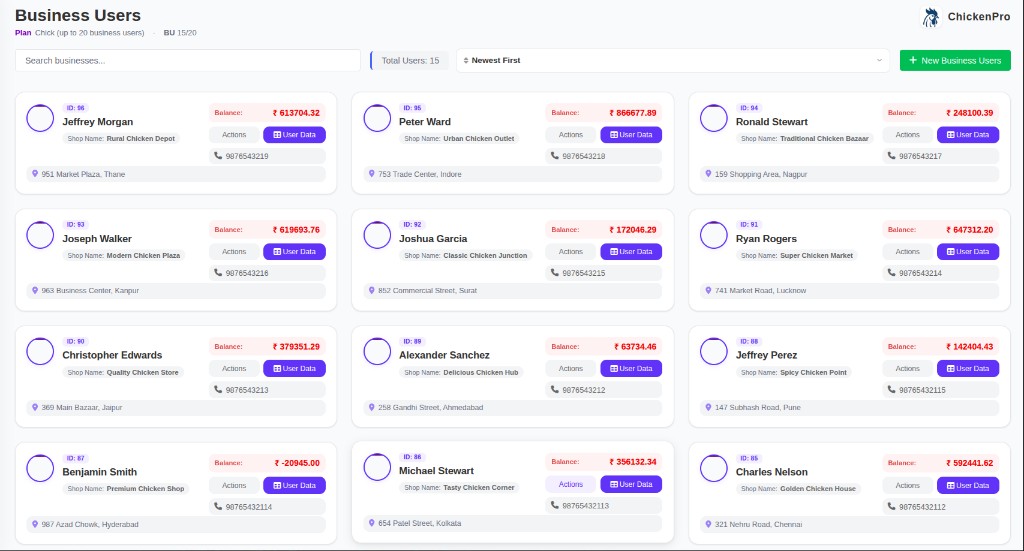
Business user cards & total counts
Manage business users in a clean card layout with total counts, running balance visibility, and quick actions.
View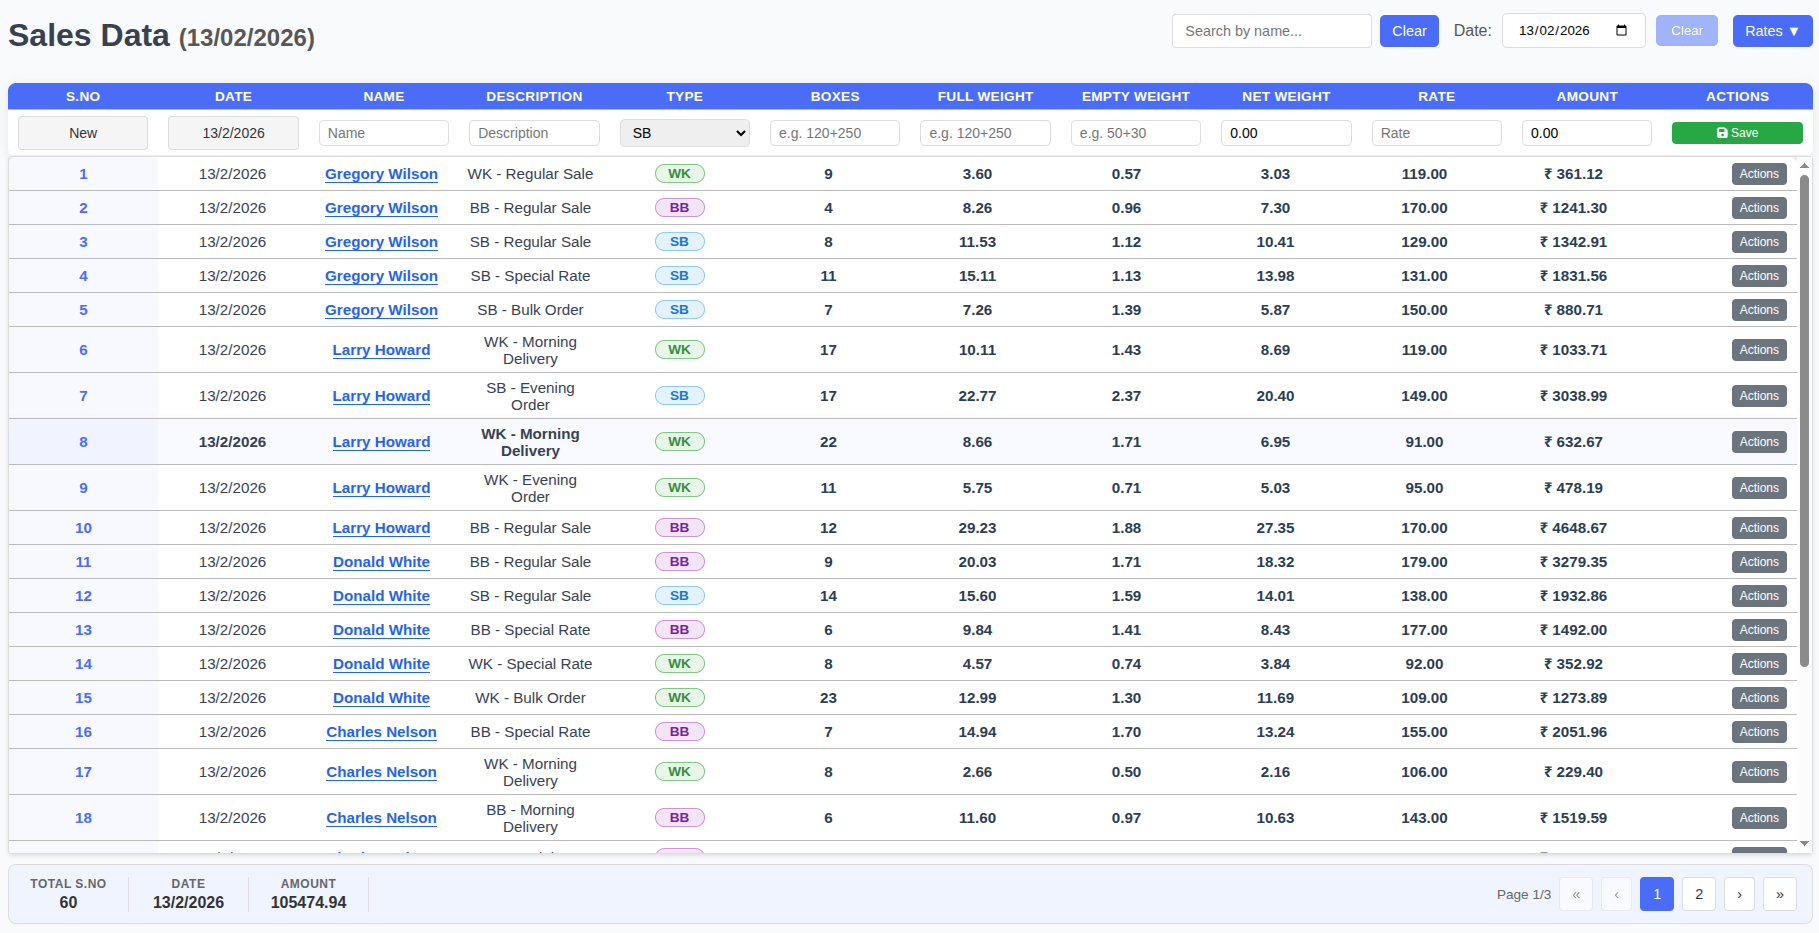
Sales data management
Manage date-based sales across all business users with summaries, weights, expenses, daily rates, and profit/loss tracking.
View