Dashboard
Dashboard overview
A single view of the numbers that matter most so you can check business performance in seconds.
Overview
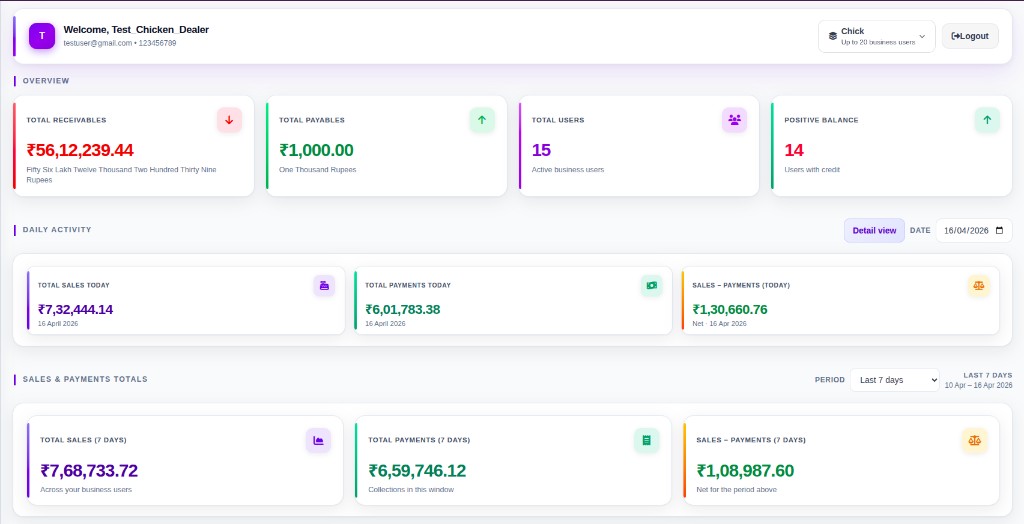
This dashboard is built to give a complete business snapshot for chicken dealers using ChickenPro. From one screen on chickenpro.in and app.chickenpro.in, you can check total receivables from all shop user balances, total payables that must be paid when other parties also use the app, total number of users, current-date sales, total collections, pending difference amounts, and visual graph trends without opening multiple pages.
- Real-time data
- Mobile friendly
- Easy navigation
- Quick actions
Balance and count summary
4 items
- Shows the total receivable count by adding all shop users' balances.
- Shows total payables that need to be paid to users or the company when other parties also use the app.
- Shows the total number of users so the business size is visible at a glance.
- Helps the dealer understand how much amount is expected in and how much still needs to be settled out.
Current date sales and collections
4 items
- Displays current-date total sales, total collections, and the difference amount.
- Makes it easy to see whether the amount is fully collected or still pending.
- Includes a details view where each row shows user sales, user payments, and the difference amount for quick comparison.
- Makes same-day follow-up easier because the dealer can quickly identify who has paid and who still has a pending amount.
User balance insights
4 items
- Lists the top 5 users with the highest balances.
- Lists the users with the lowest balances for quick follow-up.
- Includes a range selector like 7 days, 15 days, and monthly to review movement over time.
- Helps quickly compare which customers need urgent collection attention and which accounts are performing better.
Graph-based overview
4 items
- Uses graphs to showcase business movement in a simpler visual format.
- Helps dealers understand trends without checking every record manually.
- Useful for fast decision-making in poultry dealer management and chicken data management workflows.
- Makes it easier to explain business performance to partners or staff using clear visual summaries.
Use Cases
Morning business check
Scenario: Start your day by checking the dashboard to see total receivables, current sales, and collections at a glance.
Benefit: Save 15-20 minutes daily by getting instant business health overview without manual calculations.
Payment follow-up planning
Scenario: Use the top 5 highest balances list to prioritize which customers to follow up with for payments today.
Benefit: Improve collection rates by focusing on high-balance accounts first.
Weekly performance review
Scenario: Switch between 7-day, 15-day, and monthly views to analyze business trends and identify patterns.
Benefit: Make data-driven decisions about inventory and credit management based on historical trends.
Benefits vs Features
Real-time balance overview
Always know exactly how much money is owed to you and how much you owe others
Visual trend graphs
Spot business patterns instantly without analyzing spreadsheets
Top 5 balance rankings
Focus your collection efforts on accounts that matter most
Date range filtering
Compare performance across any time period to make informed decisions
Related dashboards
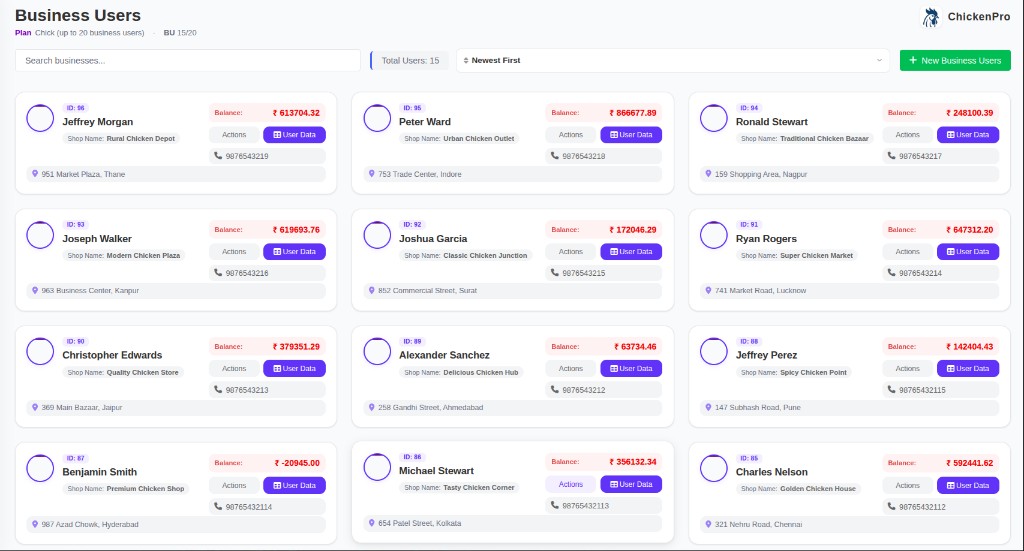
Business user cards & total counts
Manage business users in a clean card layout with total counts, running balance visibility, and quick actions.
View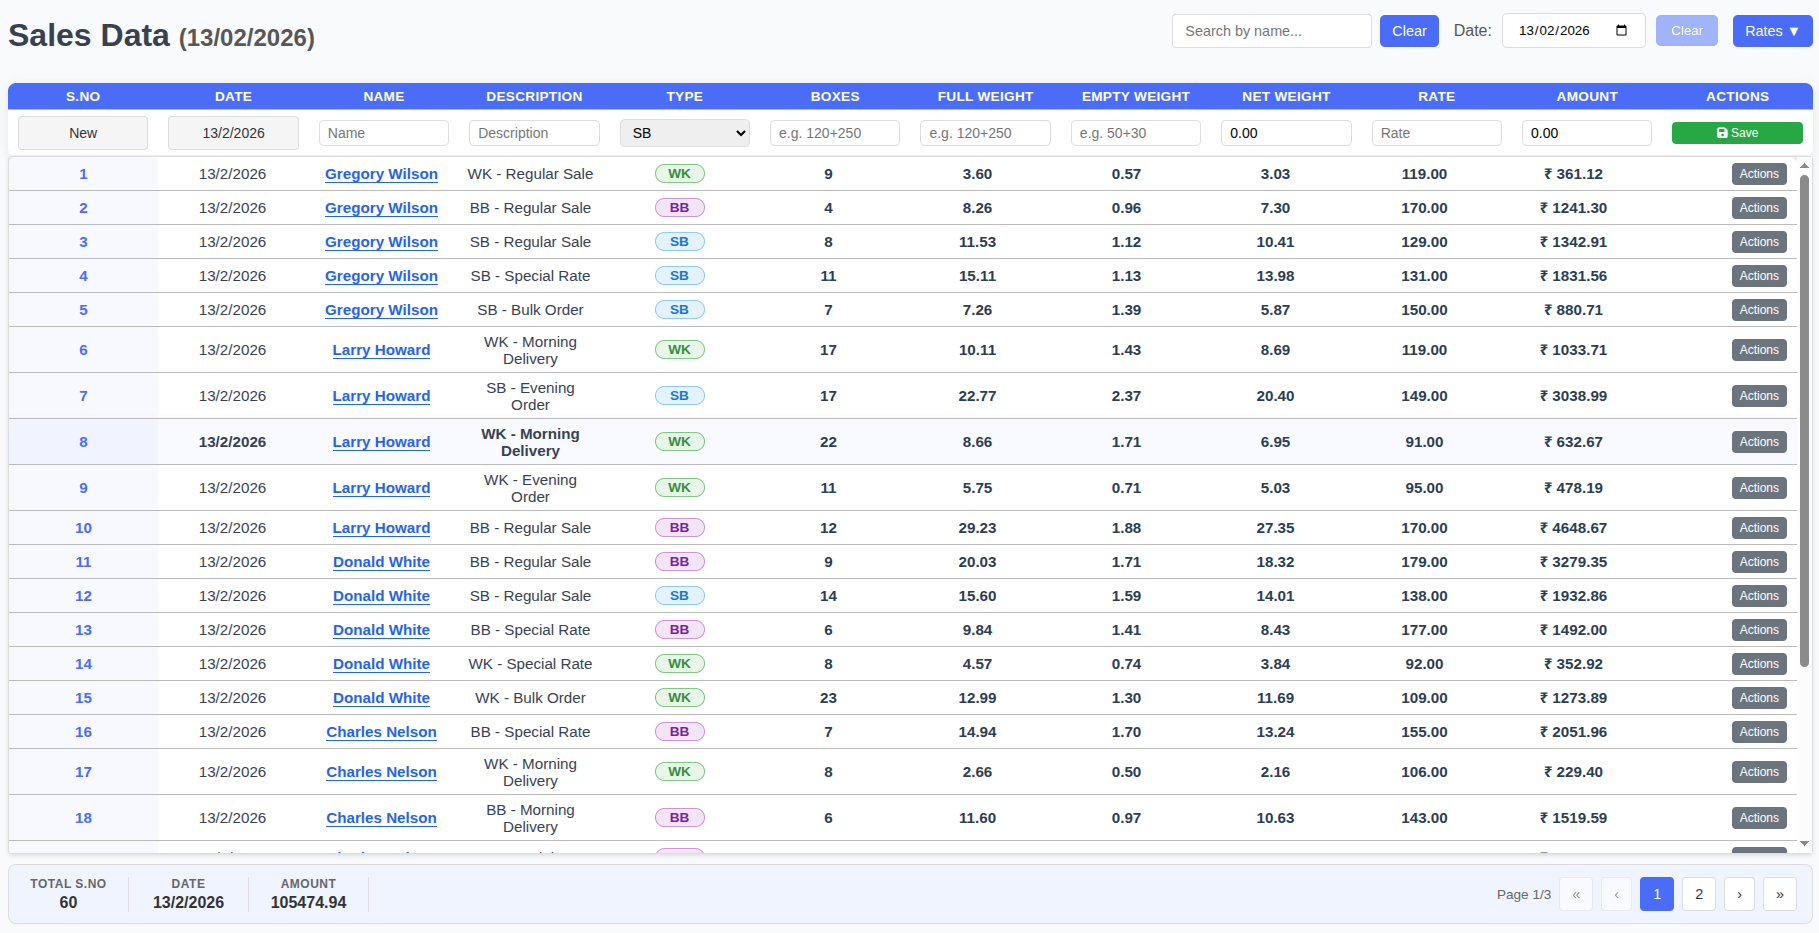
Sales data management
Manage date-based sales across all business users with summaries, weights, expenses, daily rates, and profit/loss tracking.
View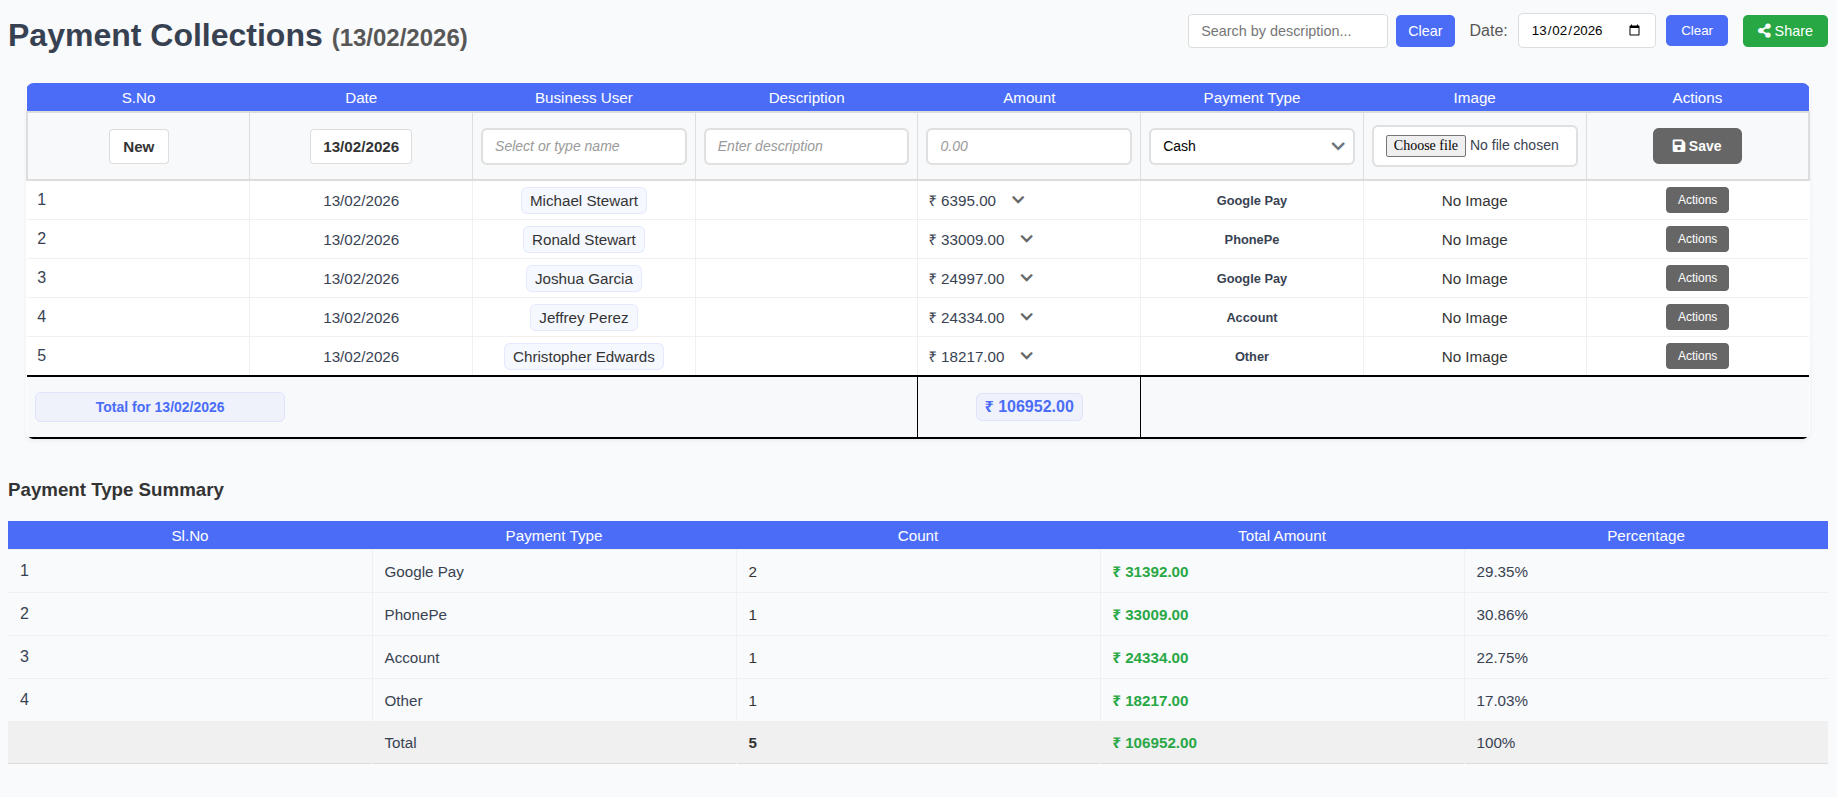
Payments & collections
Track collections by payment type with summaries, percentage breakdowns, report export, and sub-payment updates.
View